

You have a Garmin sports watch and you are using the defined workouts. When you examine your workout on the Garmin Connect page, the Execution Score appears to be very low. But no way! You did not execute the workout that badly. Isn’t it very annoying? Don’t worry. The internet is full of complaints of runners who have experienced the same. You can see dozens of angry or confused runners’ post on Reddit. So why is this happening? What is the cause? Is it us runners? Or Garmin? Is the Coach Garmin’s score too low? Or are we misunderstanding something? Let’s have a look.

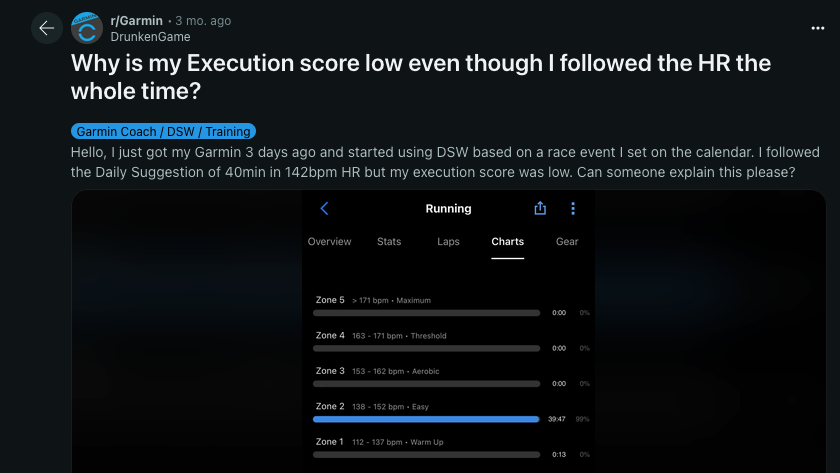
First, let’s talk about defined workouts. What is that? If you have enabled workout suggestions on your watch, I mean, if your Training Status is not paused, and you have not disabled workout suggestions temporarily, you will see Garmin suggesting a workout for you every time you start a run. These are the first group of defined workouts. Another group consists of workouts that you have created manually, via “Garmin Connect” from your phone or web browser. To understand everything better, at the end of our search for an answer, we should understand the details of defined workouts? Let’s have a look at it.

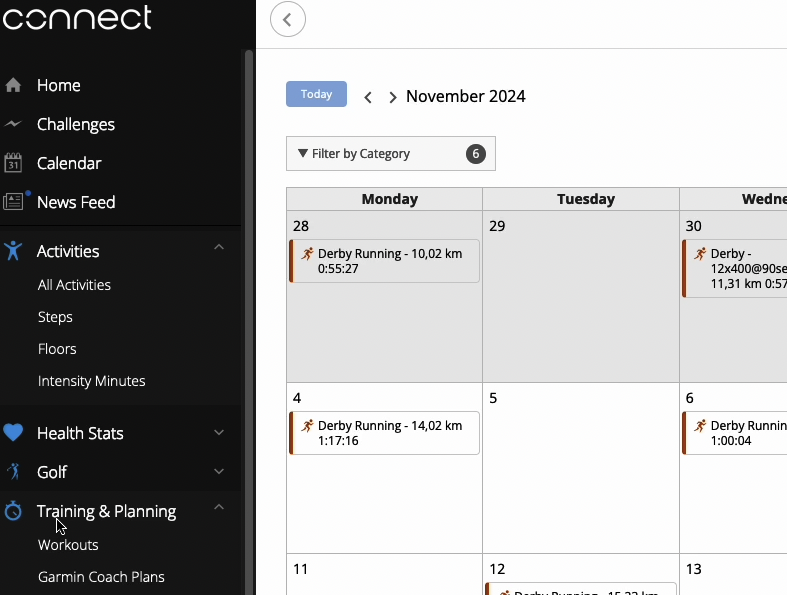
The best way to do this is to create one manually. To define a workout manually, we click “Training and Planning” section and then “Workouts” in “Garmin Connect”. Select “Run” and click “create a new workout”. The workout has a warm-up section. This is usually defined with no target. Let’s leave it that way. There are a lot of options you can choose by the way. But it is best to leave it as it is. Similarly, there is a cooldown section. You will see the same options there. But we can leave it as no target and skip it. Now, since we are creating interval training, let’s add a repeating section. Since we added the repeat section, we can delete this existing one. After determining that, let’s move on to its content. Let’s select the interval as “Distance” and set our target as “Pace”. Enter the lower and upper values. Then click OK. Fast parts will be between 3:40 and 3:50 pace, which means 3:45 on average. Setting up the rest sections, we will leave them as “no target”, as in the warm-up and cool-down. But we will clearly state the length as “time”. For this exercise, we can use the same duration as the fast section and enter 3:45. We can give a name to the workout and close it so that we can recognize it when we see it on the watch. By the way, if you close it and leave, it may not be sent to your watch. So you should either click “Send to device” on the list or you will select the “Send to device” option before closing the workout and determine which watch you will send it to. After this point, the workout will appear in your workout list after you first synchronize your watch. Okay, now we know the content of the defined workouts better. With this information, we can better understand the concept of execution score.

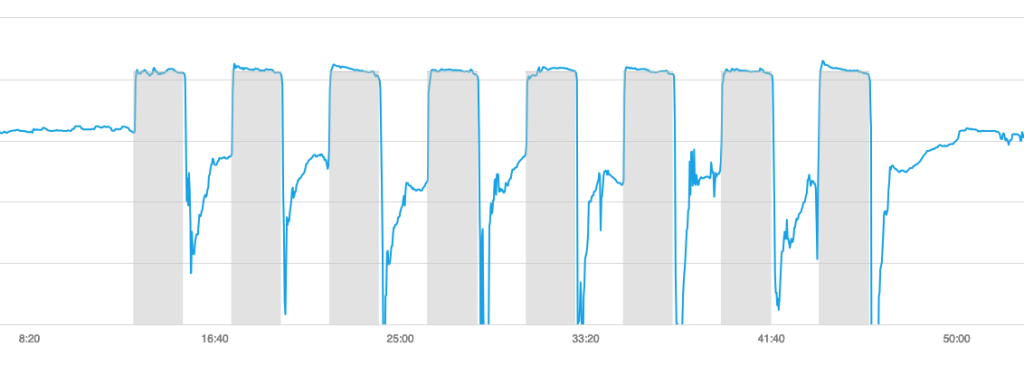
I was also complaining about this issue, like the runners I mentioned at the beginning of the video. For example, in the last defined workout I did, as you can see in the graph, Garmin gave me a score of 34%. After working so hard during the run, seeing 34% at the end makes you a little upset. And there is no one to ask, “Coach, was I that bad?”. Therefore, I shared my complaint on social media. Many runner friends sent me messages saying they had the same problem. Some even said they didn’t care any more. Realizing that the issue is common, I thought I need to understand the details. There was a mistake somewhere, but where?
First, I searched the internet for an answer. I tried to find how Garmin calculates execution score. But Garmin didn’t reveal much detail about the subject. It just says that it is a measure of how effectively you apply the prescribed steps of a planned workout. Or it says things like, “Think of it as a score a coach would give you for your workout.” Oh, and it adds this. Remember that the execution score doesn’t measure how well you perform. It measures how closely you follow the workout. In other words, it warns that if you run or ride faster or harder than the predicted target zone, you will get a low execution score as a result. Okay, good. But still, you think, I didn’t implement it that badly. At that point, a question came to my mind, how would I calculate this if I were Garmin? There were some possible solutions I thought of, but I decided to start with the simplest one first.

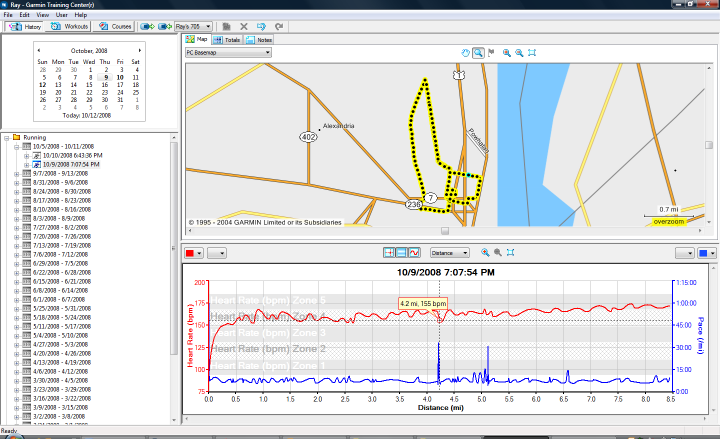
First, I downloaded the workout data to my computer. In Garmin Connect, workouts can be downloaded as FIT, TCX or GPX file. I preferred TCX. By the way, let’s talk about what does this file extension stands for. TCX stands for Training Center XML. Old runners may remember, Garmin had an application called Training Center. You could open and review your trainings in that application. In fact, its interface was like this. A CD was also delivered with the watch. Since this application is no longer around, we can say that it was a very bad decision for the file type name and the extension for it. But anyway, let’s get back to our topic.
I opened the file with a Python code I wrote. In the workout I defined, there were only targets for the fast sections. That target was a pace target. Therefore, I needed the start and finish of the fast sections and the pace information in that range. First, I found the lap start and ends in the TCX file. Then I read the paces for all data points. I compared the pace information of the data points of the fast sections with the target in the workout definition one by one. I looked at the rate of those who remained within the target pace range. Interestingly, I found exactly the value given by Garmin. Actually, I found 33.88, but Garmin rounded it up to 34.

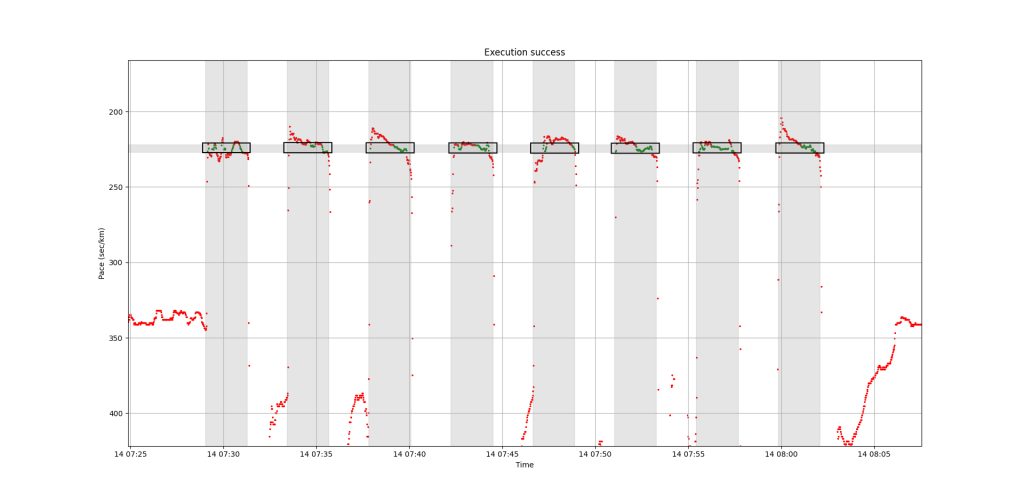
When we talk about the subject only in terms of the numbers that we found, it doesn’t make much sense. So I went a little further and created some graphs. I determined which intervals are important for us in the graph. There is time in the X-axis. I plotted those areas as gray according to the start and finish times of the fast laps. Similarly, I plotted the pace range I gave while defining the workout on the y-axis and made them gray. The data points that fall within the intersection of those two areas should be the data points that meet the target of the defined workout. So I plotted them in a different colour. Let’s have a closer look. As you can see, there are quite a few data points out of the range. In the first fast lap, I was quite far out of range, both from above and below. In the second and third, I was always out of range because I was going too fast at the beginning. Similarly, in the remaining ones, especially in the last one, I have many data points out of range because I was going too fast at the beginning. As you may have noticed, the number of reds is much higher than the greens, almost twice as much. As the number we found suggested. By the way, let me state that the pace range in the workout we examined was defined between 3:42-3:47 minutes per kilometres, which means 222 and 227 seconds. In the workout I defined as an example at the beginning of this post, I defined it different, as 3:40 and 3:50. This is an important detail.
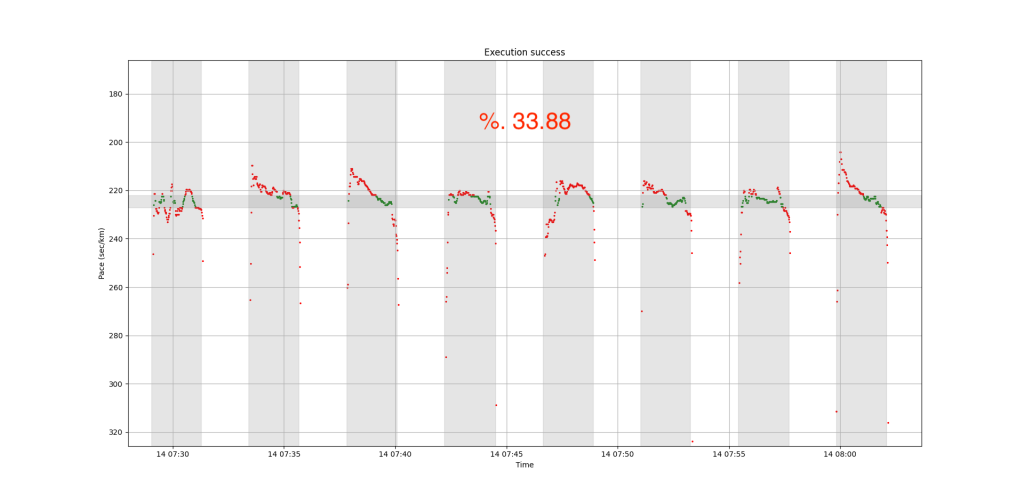
We deduced from all this that Garmin runs a very simple algorithm. The percentage of data points in the targeted ranges that are exactly within the target is your score. I thought they would use a much more complex and advanced statistical method. For example, it is very possible to be outside the target at the beginning and end of the fast sections. The negative effect of those may be lower. Or, if you run only 1 or 2 seconds faster than the target in the fast section, that may not lower the score in the calculation. OK, I agree, running too faster than the target is bad, but a small differences can be ignored. As I mentioned, algorithms like this might be a little more complex, but they could produce more meaningful evaluation results. However, Garmin now acts like a coach with very strict, sharp criteria. If you are even 1 second faster, then it shows thumbs down. So what can we do? Let’s look at it.
What we will do is actually very simple. If the coach is very sharp and strict, we should relax the criteria of the goals we give him. In other words, we should define the workouts with large tolerances. For example, in my example, it is best to define the range for the fast parts as 10 or even 15–20 seconds instead of 5 seconds. In fact, let’s see what the results would be if I had defined the target as 10, 15 and 20 seconds using the same code and the same workout data. As I mentioned, I found 33.88% for 5 seconds. This value is 65.31 for 10 seconds and 79.62 for 15 seconds. If I had defined the interval as 20 seconds and run the same workout. I would have got 89.40 as execution score.
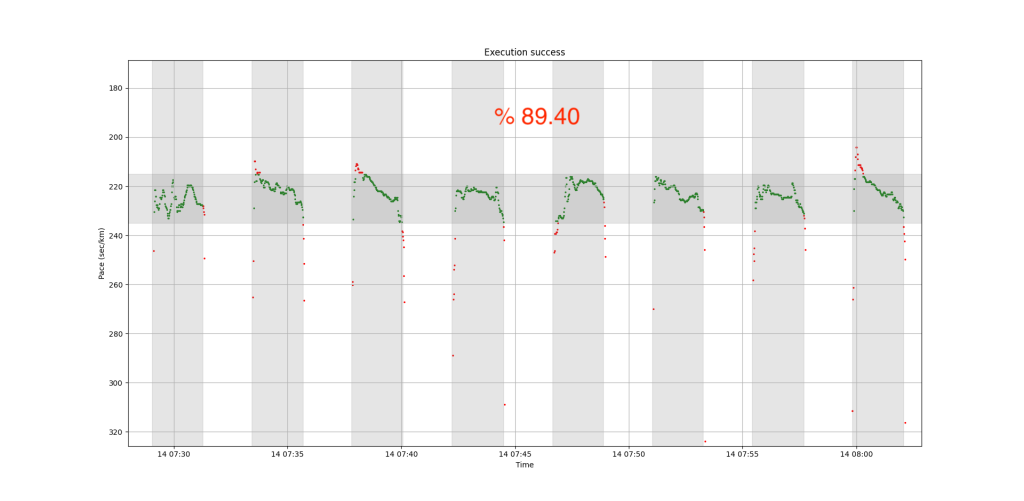
Yes, we now know how to get rid of these bad scores. We are providing the criteria to the coach. So let’s be a little more flexible and tolerant. On the other hand, it may mean something bad. Because the wider this tolerance is, the more tolerant the indicator and warnings of the watch will be during the workout. Since we follow those indicators and warnings while running, we will also act that broadly. I think we should find a balance for this. We should learn to determine an optimum interval range. For example, I will define a 12 or 14 second range from now on. I will find the most accurate range by trial and error.
I hope it was enlightening and educational. Have a good run and enjoy!